21 July 2026
Should U.S. Buyers Wait for Off-Lease Luxury EVs in 2026?
Ownership Costs
Dek: More EV leases are maturing, and Cox Automotive expects off-lease supply to keep building through the second half of 2026. The aggregate figures published this month do not show the discount that expectation implies.
If you are holding off on a used luxury EV because you expect off-lease returns to push prices down later this year, the published evidence does not support that wait.
Cox Automotive does expect off-lease supply to keep increasing through the rest of 2026. What the same company’s figures do not yet show is a discount. Cox reported an average used-EV listing price of $38,342 in June, 7% above a year earlier. The Manheim EV Index, which tracks wholesale rather than retail values, stood 12.4% higher year over year in its mid-July reading, though it eased against June.
Those are aggregate measures of the used EV market as Cox covers it. They are not luxury EV prices, and neither records what anyone actually paid. They cannot tell you what a 2023 electric sedan will cost in October. They are enough to say this much: the waiting argument assumes more cars mean lower prices, and that pattern is not in the data anyone can currently check.
Why more EV leases are maturing now
The supply side of the argument is real, and it was set three years ago when the contracts were signed. Cox Automotive’s 2026 Mid-Year Review, presented on June 24, shows an estimated lease-maturity distribution split by fuel type, with the accompanying observation that increased EV and plug-in hybrid leasing has substantially changed what comes back. In the July 17 Manheim commentary, Cox’s chief economist described wholesale inventory getting a boost from higher off-lease maturities, and expected that to continue through the second half of the year.
A second exhibit in the same deck gets read as proof that those maturities will become returns. It shows Cox’s three-year-old lease-equity measure, with gasoline and hybrid vehicles carrying higher equity while plug-in hybrids and EVs sit underwater. Negative equity may weaken the economic case for some lessees to buy the car at contract end. Whether it does, and how often, is not something these documents report. They contain no buyout rate and no return rate.
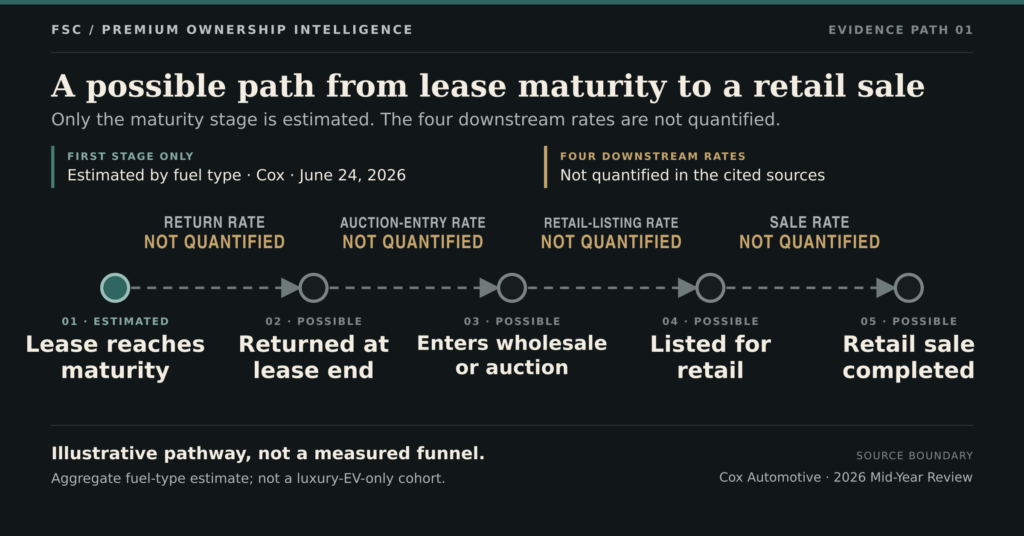
A maturing contract is also several steps away from a car you can buy. Each of those steps is a place the volume can shrink, and none of them is quantified separately in the material cited here.
What June and mid-July actually showed
Cox published its June EV Market Monitor on July 15. Used EV sales came in at 35,253 units, down 15.6% from May and 20.3% above June 2025. Days’ supply for used EVs rose to 38 days, up 17.6% month over month but 5.5% below the level a year earlier. The average listing price was $38,342, up 3.5% from May and 7% year over year.
The days’ supply number is the one most often misread as a glut. It is a ratio of inventory to selling pace, and used EV sales fell 15.6% during the same month the ratio rose 17.6%. A slower selling pace lifts that ratio even when the number of cars on the ground barely moves. Cox does not publish the split for June, so both readings stay open.
The level is more informative than the monthly change. At 38 days, used EV supply sat below the comparable gasoline-and-hybrid figure for a fourth consecutive month, with Cox noting the gap had narrowed to a single day.
Wholesale, asking, transaction: three different prices
Three prices circulate in coverage of this market, and they answer different questions. The Manheim Used Vehicle Value Index is a wholesale price index built from eligible Manheim transactions and adjusted for vehicle mix, mileage and seasonality. Its EV component was 12.4% higher year over year in the reading published on July 17. Two boundaries travel with that number. The mid-month figure is not the official monthly measure, which Manheim reports on the fifth business day of each month. And it remains a wholesale EV index, not a luxury-EV retail transaction series.
Cox’s $38,342 is an asking price: what sellers listed, not what buyers paid. Neither price measure here records a completed transaction, and the three Cox documents cited do not contain one.
Cox’s chief economist also noted that used electric vehicles have risen to over 4% of all units driving the Manheim Index, a share he described as unprecedented. That growth is measured across all electric vehicles rather than the premium end of the market.
| Figure | What it measures | What it does not measure | Source |
|---|---|---|---|
| Used EV average listing price, $38,342 (+7% YoY) | Asking prices across the used EV listings Cox covers | What buyers paid; luxury BEVs specifically | Cox EV Market Monitor, June data, published July 15, 2026 |
| Manheim EV Index, +12.4% YoY, −0.4% vs June | Wholesale values from eligible Manheim transactions, adjusted for mix, mileage and seasonality | Retail prices; residual values; luxury BEVs; completed retail sales | Manheim mid-month reading, published July 17, 2026. Not the official monthly measure |
| Used EV days’ supply, 38 days | Inventory relative to selling pace, nationally | Availability in your metro area or for your model | Cox EV Market Monitor, June data |
| Estimated lease maturity distribution by fuel type | The changing fuel mix of maturing leases | Return or buyout rates; auction or retail conversion; regional or model volumes | Cox 2026 Mid-Year Review, June 24, 2026 |
Why a rising average is not your car appreciating
The most useful sentence in the June report is not one of the headline numbers. It is Cox’s explanation of them.
The company describes the June increase in used EV listing prices as broad-based across several high-volume brands, including Tesla, Chevrolet, Hyundai and Kia, while also noting a modest mix shift: higher-priced brands such as Cadillac and BMW gained share of the used EV market as Chevrolet, Nissan and Volkswagen lost it. An average can rise because expensive cars became a larger part of what is listed, without any individual model gaining a dollar.
Cox attributes part of the recent strength to elevated fuel prices sustaining interest in efficient vehicles. The cited data do not isolate that effect, and nothing in them separates demand from mix.
The report offers one further glimpse at the premium end, and it stops at brand level. Among major used EV brands, Cox says Cadillac, Ford, Mercedes-Benz and BMW carried the highest inventory levels in June, while Genesis, Rivian, Tesla and Hyundai held some of the leanest. A brand figure covers vehicles at very different prices, sizes and ages. It does not resolve to a model year and trim in your metro area.
When waiting is rational
Waiting makes sense when you can see the thing you are waiting for: one nameplate, model year and trim watched in your own region over several weeks, with counts that grow, asking prices that get cut, and cars that sit longer before they sell. A national expectation that off-lease volume will rise is not that evidence. It cannot tell you whether the car you want will be cheaper in October.
Without that evidence, waiting is not free.
Where transferable coverage runs from the original in-service date, it keeps expiring while you wait, and on a 2022 or 2023 vehicle that window is closing during exactly the period under discussion. Terms differ by manufacturer and by coverage, so confirm it on the specific car.
Inventory also turns over rather than sitting still and getting cheaper. The combination of trim, battery, wheels, options, mileage and history you liked is not restocked; what replaces it is a different car, and not necessarily a cheaper one. Cox observes in its mid-year deck that off-lease returns skew toward well-optioned vehicles rather than the simpler, less expensive ones shoppers say they want.
Buying now is reasonable when the specific vehicle holds up: its remaining warranty position, its CPO status if it has one, a real insurance quote, your charging situation, and how you expect to exit in three to five years.
What to settle before you pay
None of this requires forecasting the market. All of it is specific to the car in front of you, and most of it decides what the next three to five years cost.
- The VIN, before anything else. Check it for open recalls through the manufacturer and the federal lookup, then again on the day you sign. If the two disagree, ask a franchised dealer to confirm in writing.
- The documented in-service date. On most programs this is the reference point for warranty math. Ask for it in writing rather than inferring it from the model year.
- What transfers, and what is left. Which coverages carry to a second owner, whether any require a transfer step or fee, and how many months and miles remain today.
- The high-voltage battery warranty, separately. Term, mileage cap, and whether it contains capacity-retention wording. If it does, ask what threshold triggers it and what the remedy is. State of health measures the battery; it is not a promise about range in your climate.
- CPO, in writing. A badge on a listing is marketing. Ask for the program document: inspection scope, coverage term, deductible, mileage cap, transferability, and how open recalls are handled.
- The exact specification. Trim, drivetrain, battery variant, wheel and tire size. These move purchase price, insurance and running cost, and the wheel and tire choice follows you for years.
- The history. Accident and damage disclosure, owner count, and whether the car was fleet, rental, a demonstrator or a lease return. Age does not establish lease origin; paperwork does.
- The two numbers left until last. An insurance quote against the actual VIN, and where the car charges on an ordinary weekday. Both shape ownership cost more than a few hundred dollars off the asking price.
If a seller cannot produce the in-service date, the battery warranty terms and the CPO document, that is information about the transaction. Price it in, or keep looking.
FAQ
Does this mean used EV prices will keep rising?
No. The year-over-year comparisons are strong; the short-run direction is not. The Manheim index fell 0.6% over the first fifteen days of July against June, and its EV component was down 0.4% over the same period. Cox describes the broader move as depreciation normalizing after an unusually strong spring. Year-over-year strength and month-over-month softness can coexist, and this article forecasts neither.
Do Cox, Manheim, Kelley Blue Book, vAuto and Autotrader count as separate confirmations?
No. They are all Cox Automotive companies, which means they belong to one corporate source family and do not provide independent corroboration. That is not a reason to dismiss the figures. It is a reason to read them as one data owner’s view rather than several agreeing ones. The two Cox exhibits used in this article already apply different rules for whether Tesla and Rivian vehicles are counted at all.
If a car is a 2023 model, is it an off-lease vehicle?
Not necessarily, and the distinction matters more than it looks. A three-year-old car may be a lease return, a private trade-in, a former rental or fleet vehicle, a demonstrator, or a repossession. Each implies different use, service patterns and paperwork. Model year establishes none of it. Ask for the documented disposition.
Sources checked
- Cox Automotive, EV Market Monitor – June 2026. Published July 15, 2026. Accessed July 19, 2026. https://www.coxautoinc.com/insights/ev-market-monitor-june-2026/
- Cox Automotive, Manheim Used Vehicle Value Index: Mid-July 2026 Trends. Published July 17, 2026. Accessed July 19, 2026. https://www.coxautoinc.com/insights/manheim-used-vehicle-value-index-mid-july-2026-trends/
- Cox Automotive, 2026 Mid-Year Review (presentation). Dated June 24, 2026. Accessed July 19, 2026. https://www.coxautoinc.com/wp-content/uploads/2026/06/Q2-2026-Cox-Automotive-Mid-Year-Review-Presentation_NEW.pdf
All three belong to one corporate source family and are not independent of one another.
What we could not verify
The three Cox documents cited here do not provide a used-EV transaction-price series, or any model-level, trim-level or regional figures for luxury battery-electric vehicles. This article does not cite an independently comparable dataset for the same period and definitions, and makes no claim about a specific nameplate, model year or metro area.
Cox’s used-EV figures carry channel boundaries. In the June monitor, Tesla and Rivian volumes reflect vehicles available through traditional dealerships and exclude factory-owned outlets; the mid-year presentation applies a different rule again. Figures from the two are not interchangeable.
The lease-maturity and lease-equity exhibits were read from the presentation’s text layer. Plotted values, time axes and the observed-versus-estimated boundary were not legible to FSC, so no figures are taken from either chart. The cited documents also do not report lease buyout, return, auction-conversion or retail-conversion rates.
The second half of 2026 is a Cox expectation rather than an observation. Data reported here runs through mid-July 2026, and the mid-month Manheim reading is not the official monthly measure. The Manheim page also carries a footer release date predating its own publication date, and page metadata reproducing an earlier month’s figures; FSC used the body text only.
FSC has not driven, inspected, charged, measured, owned, leased or tested any vehicle, and has not verified warranty, CPO, recall or insurance terms for any individual car.
Last updated
July 19, 2026.